Find Tenants Screen & Qualify Lease & Onboard Maintain & Repair Retain & Renew Turn & Re-List Measure Everything Prevent Problems AI-Ready Data Digital Twins Find Tenants Screen & Qualify Lease & Onboard Maintain & Repair Retain & Renew Turn & Re-List Measure Everything Prevent Problems AI-Ready Data Digital Twins
Theme
The Story

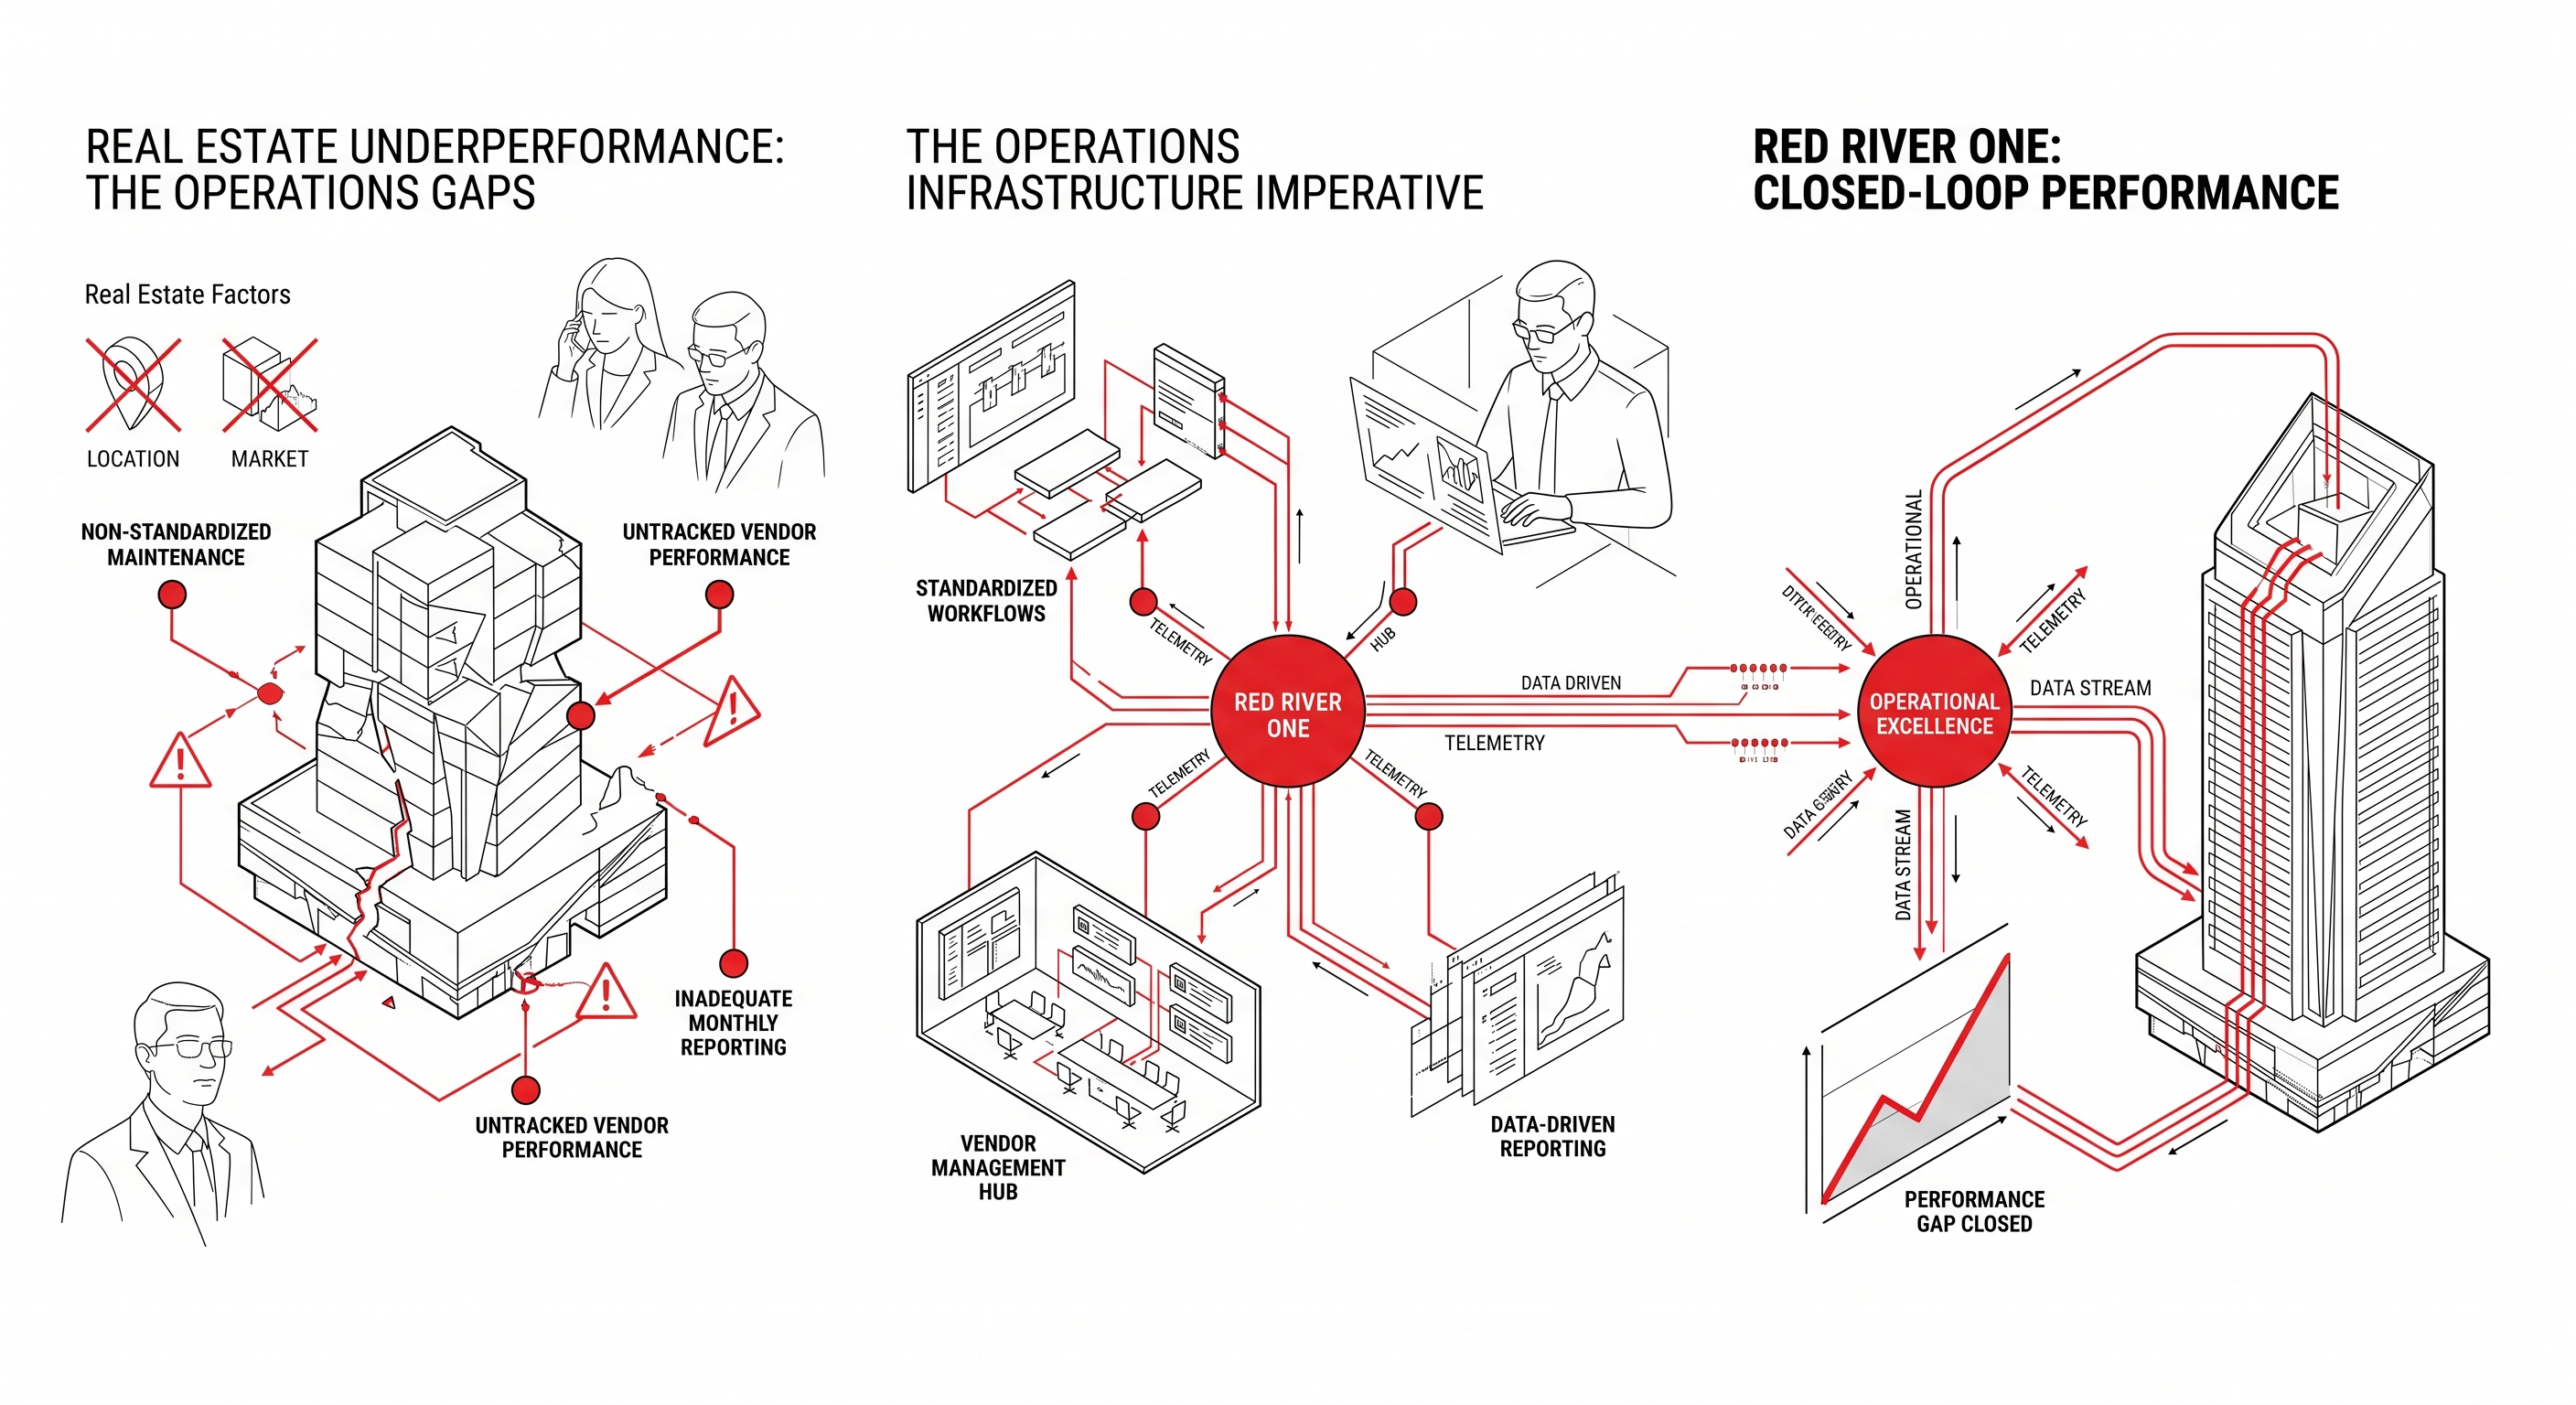
We're not trying to be everything.
Just very good at this one thing.

The founding idea behind Red River One was simple: most real estate problems aren't real estate problems. They're operations problems. A property underperforms not usually because of location or market — but because nobody standardized the maintenance workflows, nobody tracks vendor performance, and the monthly lender report is a one-page rent roll that hides everything important.

The gap between how good properties are run and how good they could be run is almost always an infrastructure problem — not a talent one.

The founding thesis
Red River One — the story
The Conviction

Real estate is the next domain.

Anand built workforce development platforms in Texas. The conviction carried into Red River One is that complex, high-stakes operations can be standardized without losing humanity.

A massive asset class, largely managed informally — and a growing appetite from capital for properties that demonstrate operational discipline. That's the gap we're built to close.

Live now Two buildings in Austin, Texas. We're getting it right here before going anywhere else.
What that looks like in practice
01
01 — Operations
We rebuild how your property runs — end to end
From the moment a prospective tenant sees your listing to the day they move out, every touchpoint has a defined process, a clear owner, and a way to measure whether it worked.
02
02 — Reporting
Numbers your capital partners will actually trust
Accurate reports — with variance narratives, honest KPIs, and the kind of transparency that turns a lender meeting into a conversation, not a defense.
03
03 — Intelligence
Clean data today. AI capability tomorrow.
Automation, anomaly detection, digital twins. This layer only works when the foundation is clean. We build toward it deliberately — so when it runs, it runs on real data, not noise.
The Conviction
The Full Picture

Every stage of a tenant's life
with your property, managed properly.

A tenant isn't a unit on a spreadsheet. They're a person who chose your property, pays you every month, and whose experience determines whether they stay, refer a friend, or quietly leave at renewal. Every stage of that relationship is an opportunity to build goodwill — or erode it.

Most property managers focus on occupancy. We focus on the full arc — from the first listing impression to the day the unit is turned and ready for the next resident. We've mapped every stage, defined what good looks like, and built the workflows to get there consistently.

This isn't a brochure — it's the actual process we run at our Austin properties, with the specific metrics we track at each stage. If you want to see the raw data, email us.

The Full Picture
Tenant Lifecycle — 8 Stages
Tap a stage to jump to it ↓
Pre-Lease
Active Tenancy
Transition
01
Pre-Lease · Finding Tenants
Marketing & Lead Generation
Before a single application arrives, we want to know exactly where leads come from — and which sources are worth paying for. Listing quality, photo standards, and response time all affect conversion in ways that only show up when you're actually measuring them.
Consistent listings across all platforms with standardized photography and copy
Every inquiry acknowledged within 2 hours — tracked, not assumed
Source tagging at entry: every lead marked so we know what's working
Waitlist management for high-demand units — no vacancy sits unmanaged
What We Measure
Lead-to-Tour Rate
% of inquiries that become showings — signals listing quality and response speed
Days on Market
Listing-live to signed application, per unit, benchmarked to local market
Lead Source Quality Score
Which channel produces the best tenants at the lowest cost-to-lease
02
Pre-Lease · Conversion
Showings & Applications
A showing is the first real impression. The unit should be clean, the agent prepared, and the follow-up same-day — not when someone remembers. Tour-to-application conversion is one of the most controllable numbers in property management, and one of the most neglected.
Unit showing checklist completed before every tour — lights, HVAC, cleanliness, all fixtures working
Same-day follow-up to every prospective tenant who toured, regardless of outcome
Application process simplified — every unnecessary step costs a conversion
Cancelled showings tracked and root-caused: time of day, listing quality, or price?
What We Measure
Tour-to-Application Rate
Clearest signal of leasing effectiveness — if low, it's the unit, price, or experience
Application-to-Approval Rate
Tracks criteria alignment; too high or too low both signal something to fix
Follow-Up Compliance %
% of tours with same-day follow-up — a discipline metric, not a result one
03
Pre-Lease · Risk & Compliance
Screening & Approval
Screening isn't just risk management — it's the beginning of the tenant relationship. Written, consistently applied criteria mean every decision is defensible, every applicant treated fairly, and no one is exposed to fair housing liability from ad-hoc judgment calls.
Written criteria applied uniformly: income ratio, credit thresholds, rental history, background — defined in advance
Decision timeline published; no application unanswered beyond 48 hours
Adverse action notices handled correctly and on time — legal requirement, tracked to the day
All approvals and denials documented with reason codes for the audit trail
What We Measure
Approval Consistency Score
Are decisions tracking against stated criteria, or drifting? Drift creates legal exposure.
Decision Turnaround Time
Hours from complete application to decision — delays lose qualified applicants
Adverse Action Compliance
100% is the only acceptable number. We track it as such.
04
Active Tenancy · Day One
Move-In & Onboarding
Move-in day is the moment a tenant decides whether they made the right choice. A smooth, organized, welcoming onboarding builds goodwill that carries through the entire tenancy. A disorganized one starts a relationship with a deficit — and tenants remember it at renewal time.
Unit inspection completed and documented with photos before keys are handed over
Move-in condition report signed by both parties — the baseline that protects everyone at move-out
Welcome packet with emergency contacts, maintenance process, community rules — in writing, not verbally
30-day check-in call scheduled at move-in day. Proactive. The cheapest retention investment we make.
What We Measure
Move-In Readiness Score
Was the unit 100% ready on day one? Checked against a defined checklist, not a feeling.
Documentation Completeness
Signed move-in report, executed lease, utility transfer — all on file before keys go out
30-Day Check-In Rate
% of new tenants who got their first proactive check-in. Tracked weekly.
05
Active Tenancy · Day-to-Day
Maintenance & Vendor Management
Maintenance is where most property management falls apart — and where tenants form their lasting opinion. It's not just about fixing things. It's about communicating clearly, following up, and making people feel heard. We treat every work order as a relationship touchpoint, not just a task in a queue.
Every request logged on receipt — no verbal approvals, no informal group-chat fixes, no exceptions
Tenant notified at each stage: received → assigned → scheduled → completed
Vendor dispatch tied to qualification criteria — not just whoever picks up the phone
Photo verification required before any work order is closed — proof of completion, not trust
Preventive maintenance calendar: HVAC filters, gutters, pest control — scheduled ahead of failure
Vendor scorecards updated monthly: response time, callback rate, cost vs. estimate, tenant feedback
What We Measure
Work Order SLA Compliance
Emergency: 4hr. Urgent: 24hr. Routine: 5 days. Every ticket rated against these benchmarks.
Vendor Callback Rate
How often does a "completed" job return? High rate = wrong vendor or wrong scope. Both fixable.
Preventive vs. Reactive Ratio
Are we fixing things before they break, or after? The ratio shows how far ahead we're operating.
06
Active Tenancy · Relationship
Retention & Renewal
Keeping a good tenant is almost always cheaper than finding a new one. The cost of a vacancy — lost rent, turn costs, leasing time — can run $2,000–$5,000 per unit. Most properties wait until 60 days before lease end to have the renewal conversation. By then, the tenant has already decided. We start 120 days out — and we watch for the signals that predict a non-renewal before the tenant says a word.
Renewal outreach starts 120 days before expiry — not 60. Earlier contact produces higher renewal rates.
Satisfaction check-in at 90 days: open issues resolved before the renewal offer goes out
Renewal offers personalised — not a generic form letter with a rent increase attached
Non-renewal reasons categorised: price, condition, service, or life change. Each needs a different response.
Early warning signals tracked: late payments, maintenance complaint frequency, reduced portal activity
What We Measure
Renewal Rate
% of eligible tenants who renew. Goal: understand every non-renewal, not just count them.
First Contact Lead Time
Days before expiry of first renewal touchpoint. Earlier is consistently better.
Non-Renewal Root Cause Mix
Categorised so we act on what's within our control — not just accept the loss.
07
Transition · Departure
Move-Out & Security Deposit
Move-out is where legal exposure is highest and relationships most fragile. It's also where sloppy record-keeping from move-in comes back to haunt you. We run a tight, documented process — because it's right, and because the alternative is disputes, bad reviews, and sometimes litigation.
Move-out instructions sent 60 days before departure — no surprises about expectations or cleaning standards
Move-out inspection within 24 hours of key return, with full photo documentation of every room
Move-in condition report used as baseline — every charge reconciled against documented pre-existing condition
Deposit itemised and returned within statutory deadline — tracked to the day, no exceptions
What We Measure
Deposit Return Compliance
% returned within statutory deadline. Legal requirement — we treat it as a discipline metric.
Deposit Dispute Rate
Disputes signal poor move-in documentation or unjustified charges. Both preventable.
Charge Substantiation Rate
% of deductions backed by evidence from both inspections. 100% is the target.
08
Transition · Reset
Unit Turn & Make-Ready
Every day a unit sits vacant after move-out is money out of the owner's pocket. Turn time is one of the highest-ROI levers in multifamily — and one of the most ignored. We treat each turn like a small construction project: scoped in advance, scheduled tightly, tracked against a hard completion date.
Turn scope finalised within 48 hours of move-out inspection — no waiting to "walk it again"
Make-ready checklist covers every system: HVAC, plumbing, appliances, paint, flooring, fixtures, deep clean
Vendor scheduling coordinated in sequence — no trades sitting idle waiting on each other
Target move-in date set at turn start; every day of overrun tracked and root-caused, not accepted
Re-inspection before keys go out — the next tenant's move-in report is the final quality check on the turn
What We Measure
Turn Time (Days)
Move-out to move-in-ready. Every day counts. Tracked per unit, trended over time.
Turn Cost vs. Budget
Scope defined upfront, actuals compared at close. Variance investigated, not silently accepted.
Make-Ready Pass Rate
% of units that pass re-inspection on first attempt — quality indicator for the turn process itself.

These eight stages are a loop, not a line. The quality of each turn shapes the next move-in experience. That experience shapes whether the tenant maintains well, renews, and refers. Good operations compound — but only if every stage is actually managed and measured. Miss one consistently, and the rest quietly degrades.

How We Measure

Garbage In, Garbage Out.
So we're obsessive about the inputs.

We've seen a lot of property dashboards. They look impressive — charts, trend lines, occupancy percentages. And then you ask: where does that number actually come from? The honest answer is usually "it's what the property manager entered into the system."

A KPI built on unmeasured activity isn't a metric. It's a guess in a spreadsheet wearing a suit.

We built our measurement approach around one principle: we only report what we can directly trace to a logged event. A work order is closed when a photo is uploaded and reviewed — not when someone marks it done. A unit is vacant when it's recorded with a date stamp — not when someone updates the whiteboard. A vendor is paid when the invoice matches the approved scope and the work is verified — not when someone says it looks fine.

This sounds obvious. Almost nobody does it. The reason most property KPIs are unreliable is that underlying data is entered manually, inconsistently, and often after the fact. Our job is to build systems where data captures itself — so by the time a metric appears in a report, it reflects something that actually happened.

We're honest about where we stand. We're 12 months in. Our metrics are improving, not perfect. But we can show you exactly how each one is calculated, what its data source is, and what confidence level we'd put on it. That's a higher bar than most operators hold themselves to — and it's the only foundation that makes AI and digital twins actually useful.

Our KPI policy: We don't include a metric in any report unless we can trace it to a primary source event. We don't round numbers to look better. We don't average over a period to hide a bad month. And when a metric is in progress — like our unit turn time data — we say so clearly.

From Measurement to Prevention

The Measurement Loop
Every metric feeds a decision. Every decision changes an action. Every action produces new data. This is how you prevent problems instead of react to them.
M
Measure
Log at source
A
Analyse
Find patterns
F
Flag
Surface anomalies
A
Act
Named owner, specific action
P
Prevent
Problem doesn't recur

The whole point of measuring is to stop reacting and start anticipating. Here's how specific KPIs translate into specific preventive actions — in the protocols we run at our Austin properties right now.

Maintenance Spike Detection
When work orders for a system run 20%+ above the 90-day average, we schedule an inspection — catching the failing compressor before it dies in August.
Early Renewal Warning
Tenants with 2+ complaints a quarter, or dropping portal activity, get a proactive check-in 90 days out — so the renewal talk starts before the decision is made.
Vendor Performance Gates
Any vendor above a 15% callback rate in 30 days goes on review. Two bad months and they're replaced — on record, not instinct.
Rent Leakage Audit
Monthly reconciliation of what should have been billed versus what was. Leakage is usually accidental — a waived fee, a missed charge. We catch it every month.
Turn Time Overrun Response
A unit 3+ days over turn target triggers daily checks, each overrun root-caused — scope creep, vendor delay, or scheduling. That reshapes the next turn.
Leasing Source Re-Allocation
Each quarter we review cost per qualified applicant and lease quality by channel, shifting spend toward what produces good tenants — not just volume.

Three KPI Tiers. Each with a Specific Job.

Not all metrics need the same cadence. Some tell you whether today is going well. Others tell you whether next quarter will.

01
Tier 1 · Foundation
Operational Health
Daily / Weekly

Discipline metrics — are basic processes being followed? Not exciting. Essential. If these aren't green, nothing above them means anything.

Work Order SLA Compliance %Open Work Orders by AgeInquiry Response TimeRent Collection RateLate Payment CountVendor Response TimeMake-Ready Status by Unit
02
Tier 2 · Performance
Financial Performance
Monthly

These go into the lender package and investor update. They need to be accurate before being shared — not estimated, not rounded. These numbers build or destroy credibility with capital.

NOI vs. Budget VarianceGross Revenue vs. Pro FormaOperating Expense RatioEconomic OccupancyCapex vs. PlanRent LeakageVendor Cost Variance
03
Tier 3 · Foresight
Trend & Prevention
Quarterly

Where patterns become strategy — looking for things about to become problems, not things already broken. These feed the prevention playbook for next quarter.

Renewal Rate TrendNon-Renewal Root Cause MixVendor Callback Rate (90d)Lead Source Quality ScorePreventive vs. Reactive RatioComplaints per UnitTurn Time Portfolio Trend
How We Work

We show up, learn the property,
and fix it in the right order.

Good operations come from doing the basics really well, in the right sequence, before adding any complexity.

The path to intelligent property operations — diagnostic and mapping, establishing core operations, then layering in advanced intelligence
  1. 01
    Weeks 1–4Diagnostic

    Map what exists

    We spend the first 2–4 weeks walking every process: how does a maintenance request actually get handled? Who approves vendor payments? How is the leasing team tracking leads? No judgment — just an honest picture of where things stand, with notes on what's working and what isn't.

  2. 02
    Months 1–3Operations + Reporting

    Rebuild the foundations

    Define workflows across all 8 lifecycle stages, assign owners, set SLAs, establish approval thresholds. Stand up the monthly reporting package. Get every event into the system. Unglamorous work — and the only work that makes everything else possible.

  3. 03
    Month 3+Intelligence & AI Readiness

    Layer in intelligence

    Once operations are clean and reporting is consistent, the data becomes worth something. Anomaly detection, automation, digital twin layers — built on a foundation that supports them. This layer only tells you the truth if the underlying data does too. We don't rush this step.

What 90 days looks like: A complete operational audit. Structured workflows deployed across the full tenant lifecycle. Your first lender-ready monthly report. A clear picture of where money is being lost or left on the table. And the beginnings of an AI-ready data foundation that will compound in value the longer we operate together.

Work With Us

Have a property that deserves
to be run better?

We're selective. We take on properties where we believe we can produce a measurable operational improvement within 90 days — visible change across the full tenant lifecycle, backed by data you can show a lender. If you're a property owner, investor, or operator looking for a genuine systems partner, let's have a real conversation.